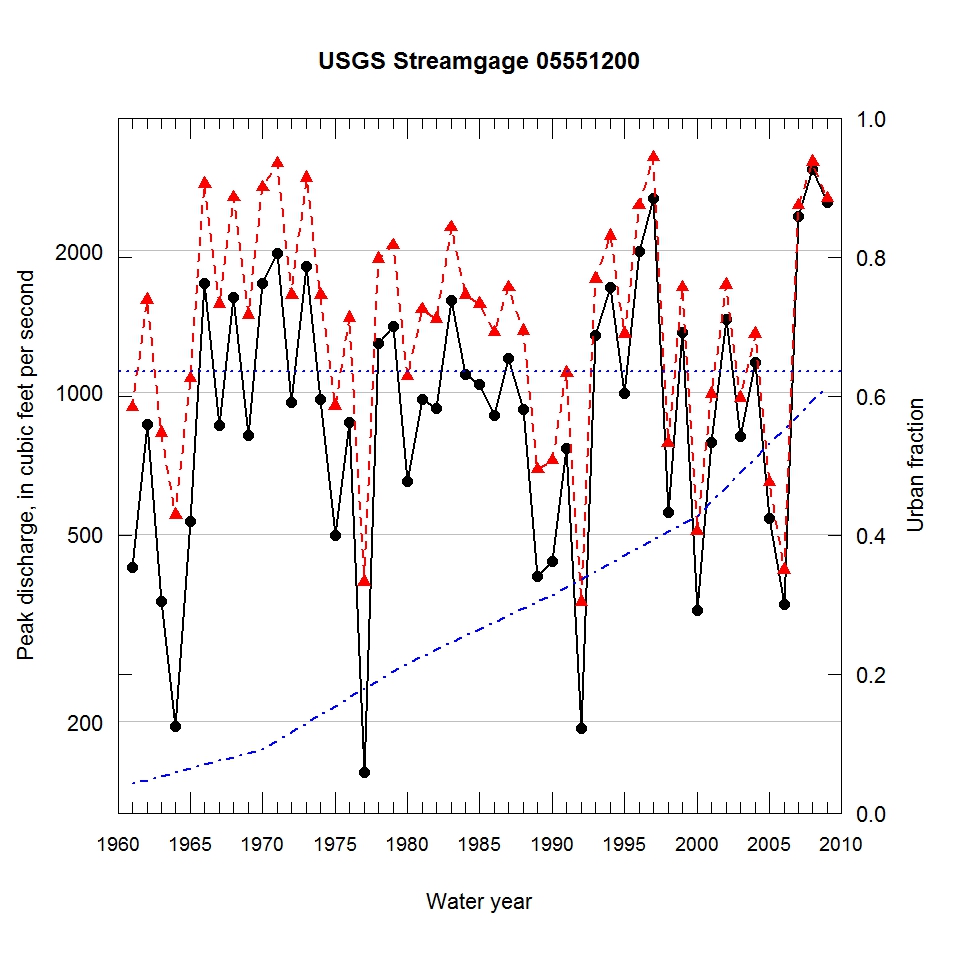
Observed and urbanization-adjusted annual maximum peak discharge and associated urban fraction and precipitation values at USGS streamgage:
05551200 FERSON CREEK NEAR ST. CHARLES, IL


| Water year | Segment | Discharge code | Cumulative reservoir storage (acre-feet) | Urban fraction | Precipitation (inches) | Observed peak discharge (ft3/s) | Adjusted peak discharge (ft3/s) | Exceedance probability |
| 1961 | 1 | -- | 156 | 0.042 | 1.532 | 425 | 929 | 0.772 |
| 1962 | 1 | -- | 156 | 0.048 | 0.277 | 855 | 1570 | 0.345 |
| 1963 | 1 | E | 156 | 0.053 | 1.175 | 360 | 819 | 0.837 |
| 1964 | 1 | E | 156 | 0.059 | 0.746 | 195 | 549 | 0.950 |
| 1965 | 1 | -- | 156 | 0.064 | 0.114 | 531 | 1070 | 0.677 |
| 1966 | 1 | D | 156 | 0.070 | 0.742 | 1700 | 2770 | 0.059 |
| 1967 | 1 | -- | 156 | 0.075 | 1.553 | 852 | 1540 | 0.365 |
| 1968 | 1 | -- | 156 | 0.081 | 2.484 | 1590 | 2590 | 0.072 |
| 1969 | 1 | -- | 156 | 0.086 | 0.108 | 810 | 1460 | 0.406 |
| 1970 | 1 | -- | 156 | 0.092 | 1.855 | 1700 | 2720 | 0.062 |
| 1971 | 1 | D | 156 | 0.104 | 0.320 | 1970 | 3060 | 0.042 |
| 1972 | 1 | -- | 156 | 0.116 | 1.618 | 950 | 1610 | 0.322 |
| 1973 | 1 | -- | 343 | 0.129 | 1.662 | 1850 | 2850 | 0.053 |
| 1974 | 1 | -- | 343 | 0.141 | 0.881 | 968 | 1610 | 0.327 |
| 1975 | 1 | -- | 343 | 0.154 | 1.167 | 496 | 934 | 0.769 |
| 1976 | 1 | -- | 343 | 0.166 | 1.418 | 864 | 1440 | 0.422 |
| 1977 | 1 | E | 343 | 0.179 | 1.215 | 156 | 396 | 0.981 |
| 1978 | 1 | -- | 343 | 0.191 | 1.936 | 1270 | 1920 | 0.190 |
| 1979 | 1 | D | 343 | 0.203 | 0.307 | 1380 | 2050 | 0.160 |
| 1980 | 1 | -- | 343 | 0.216 | 0.367 | 646 | 1080 | 0.671 |
| 1981 | 1 | -- | 343 | 0.226 | 2.008 | 967 | 1500 | 0.387 |
| 1982 | 1 | -- | 343 | 0.235 | 0.341 | 925 | 1430 | 0.428 |
| 1983 | 1 | -- | 343 | 0.245 | 1.414 | 1570 | 2240 | 0.121 |
| 1984 | 1 | -- | 343 | 0.255 | 0.618 | 1090 | 1610 | 0.324 |
| 1985 | 1 | -- | 343 | 0.265 | 1.270 | 1040 | 1540 | 0.365 |
| 1986 | 1 | -- | 343 | 0.275 | 0.995 | 893 | 1340 | 0.488 |
| 1987 | 1 | -- | 343 | 0.284 | 2.134 | 1180 | 1670 | 0.289 |
| 1988 | 1 | E | 343 | 0.294 | 0.523 | 922 | 1350 | 0.481 |
| 1989 | 1 | E | 343 | 0.304 | 1.122 | 407 | 686 | 0.905 |
| 1990 | 1 | E | 343 | 0.314 | 1.217 | 438 | 717 | 0.891 |
| 1991 | 1 | -- | 343 | 0.325 | 0.854 | 759 | 1100 | 0.653 |
| 1992 | 1 | E | 343 | 0.336 | 0.521 | 193 | 359 | 0.985 |
| 1993 | 1 | -- | 343 | 0.348 | 0.951 | 1320 | 1740 | 0.254 |
| 1994 | 1 | -- | 343 | 0.359 | 0.629 | 1670 | 2150 | 0.140 |
| 1995 | 1 | -- | 343 | 0.371 | 1.040 | 993 | 1330 | 0.490 |
| 1996 | 1 | -- | 343 | 0.382 | 2.612 | 1990 | 2490 | 0.082 |
| 1997 | 1 | -- | 343 | 0.393 | 2.174 | 2580 | 3150 | 0.038 |
| 1998 | 1 | E | 343 | 0.405 | 1.132 | 556 | 778 | 0.860 |
| 1999 | 1 | -- | 343 | 0.416 | 0.965 | 1340 | 1670 | 0.290 |
| 2000 | 1 | CE | 343 | 0.427 | 0.991 | 345 | 506 | 0.958 |
| 2001 | 1 | C | 343 | 0.448 | 0.665 | 781 | 991 | 0.732 |
| 2002 | 1 | C | 343 | 0.469 | 1.426 | 1430 | 1690 | 0.281 |
| 2003 | 1 | CE | 343 | 0.490 | 1.362 | 807 | 973 | 0.745 |
| 2004 | 1 | C | 343 | 0.510 | 1.677 | 1160 | 1330 | 0.491 |
| 2005 | 1 | C | 343 | 0.531 | 0.769 | 541 | 643 | 0.925 |
| 2006 | 1 | CE | 343 | 0.552 | 1.101 | 355 | 419 | 0.975 |
| 2007 | 1 | C | 343 | 0.573 | 3.045 | 2360 | 2490 | 0.081 |
| 2008 | 1 | C | 343 | 0.594 | 4.409 | 2980 | 3080 | 0.040 |
| 2009 | 1 | C | 343 | 0.614 | 0.830 | 2530 | 2580 | 0.072 |

